Structural Health Monitoring for Bridges and Tunnels


Most bridges and tunnels are assessed by inspection: someone qualified looks at the structure on a schedule and records what they find (23 CFR 650.311). It works, and it has one structural weakness. It tells you the condition on the day of the visit, and says nothing about the eighteen months in between. Structural health monitoring using distributed fiber closes that gap without putting anyone in a harness.
What continuous measurement adds
Point sensors have monitored structures for decades. Strain gauges and accelerometers give precise readings at the locations somebody chose in advance, which is the limitation: they measure where you already suspected a problem.
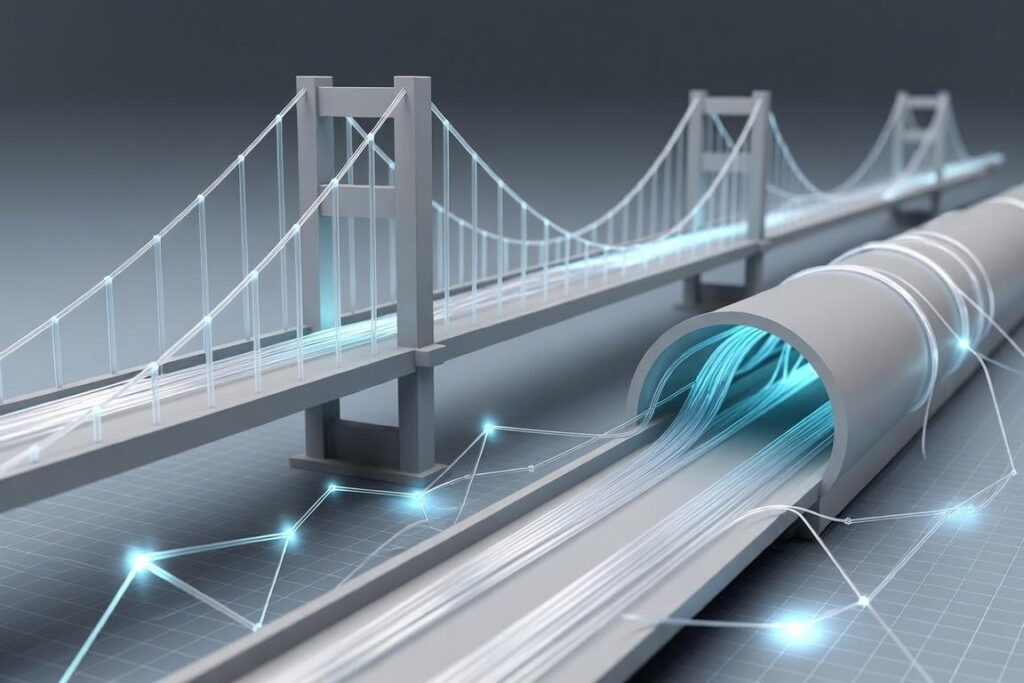
Distributed sensing reverses that. A fiber running the length of a deck, bonded to a girder or cast into a tunnel lining, measures strain and temperature at every meter (Bao and Chen, Sensors 2012). You are not choosing measurement points, you are covering the structure.
What that reveals in practice
- Load distribution across the full span, including how it changes as bearings age.
- Crack initiation at locations no inspection schedule had flagged.
- Thermal behavior, which matters because a large share of apparent strain is temperature and has to be separated out.
- Convergence in tunnel linings, the slow inward movement that precedes serious problems.
Structural health monitoring: separating signal from season
The most common mistake in structural monitoring is reading thermal expansion as damage. A steel bridge moves substantially between a winter night and a summer afternoon, and none of that movement means anything is wrong.
This is why temperature and strain are measured together rather than separately. Distributed Temperature Sensing gives 0.03 °C resolution over the same route, so the thermal component can be modeled and removed. What is left is the mechanical behavior, which is the part worth alarming on.
It also means the first year of data is mostly about learning the structure’s normal range through a full seasonal cycle. Systems that alarm from day one against generic thresholds generate noise. Systems that establish a baseline first generate findings.
Retrofit versus new build for structural health monitoring
New construction is the ideal case. Fiber cast into concrete during the pour costs very little and gives measurements from the structure’s first day, which means the baseline is the as-built condition rather than a guess.
Retrofit is more common and entirely workable. Fiber can be surface-bonded to girders, run in existing cable routes, or fixed along a tunnel lining. The installation is the main cost, and it is usually a fraction of the cost of the access equipment a comparable inspection program requires over the same period.
Who this is for
The case is strongest where access is difficult or expensive, where the structure is critical to a network with no alternative route, or where an existing structure is being asked to carry more than it was designed for. In those situations, continuous data changes maintenance from calendar-driven to condition-driven, and that is where the savings are.
Establishing a structural health monitoring baseline
A monitoring system installed on an existing structure does not know what normal looks like. It has to learn, and that takes a full seasonal cycle.
The first months should be treated as data collection rather than surveillance. What the structure does on a cold morning, under peak traffic, and through a summer afternoon defines the envelope. Only once that envelope is known does an excursion outside it mean anything.
Systems configured with generic thresholds from day one produce alarms that engineers correctly ignore, and the credibility lost in the first month is difficult to recover.
What to instrument first on a limited budget
Full coverage of every element is rarely the starting point. The elements that usually justify instrumentation first are the ones where failure is both plausible and consequential.
- The main span, where load effects are largest.
- Bearings and expansion joints, which restrain movement and show it clearly when they stop working.
- Any element already flagged by inspection, where continuous data replaces waiting for the next visit.
- Tunnel sections in weaker ground, or under new surface loading.
Feeding structural health monitoring into asset management
Continuous data changes maintenance from calendar-driven to condition-driven, but only if it reaches the people planning the work. A stream that lands in an engineering folder nobody opens has not changed anything.
The useful output is not a live dashboard. It is a periodic condition summary in the format the asset management process already consumes, with the underlying data available when something needs investigating. Deciding that format before installation is what makes the difference between a monitoring system and a data collection exercise.
See our approach to structural health monitoring, or the related work on railway networks.
Talk to an Engineer and tell us what you need to monitor. We will tell you whether fiber sensing is the right fit, and how to deploy it.
Frequently asked questions
Why add continuous monitoring to bridge and tunnel inspections?
Inspection tells you the condition on the day of the visit and says nothing about the months in between. Point sensors such as strain gauges and accelerometers measure only where somebody already suspected a problem. A distributed fiber bonded to a girder or cast into a tunnel lining measures strain and temperature at every meter of the structure.
What does distributed sensing reveal on a bridge or tunnel?
Load distribution across the full span, including how it changes as bearings age; crack initiation at locations no inspection schedule had flagged; thermal behavior, which has to be separated from strain; and convergence in tunnel linings, the slow inward movement that precedes serious problems.
How do you avoid reading thermal expansion as structural damage?
By measuring temperature and strain together. Distributed Temperature Sensing over the same route lets the thermal component be modeled and removed, leaving the mechanical behavior, which is the part worth alarming on. The first year of data is mostly about learning the normal range of the structure through a full seasonal cycle.
Can structural health monitoring be retrofitted to an existing structure?
Yes. Retrofit is more common than new build and entirely workable. Fiber can be surface-bonded to girders, run in existing cable routes, or fixed along a tunnel lining. The installation is the main cost, and it is usually a fraction of the cost of the access equipment a comparable inspection program requires over the same period.